
Oil Prices
EKT Interactive has launched Oil Prices Daily – a daily newsletter summarizing oil prices movement and the news and events that influence oil prices.
Oil Prices
History of Oil Prices, Supply & Trading
Oil prices, oil price volatility and trading have always been an integral part of the oil business. Researchers point out that in 1859, crude oil was selling for $20/bbl and two years later the oil prices were only 52 cents.
Speculators would buy huge quantities of crude after an especially successful wildcat well had made the oil prices drop, store it in tanks and wait for the price to rise again.
JD Rockefeller realized that control of supply was the key to success in the business. His initial focus was “cooperation” (later named a monopoly) between refining, transportation and sales. By 1879, Standard Oil controlled 95% of oil refining in the US.
Managing supply logistics was also a global challenge from the industry beginnings. In 1878 the son of a London businessman who sold seashells, named Marcus Samuel, discovered the the oil export business. In the process Shell Oil Company was created.
Oil Prices: Petroleum Exchanges, Futures Contracts, Hedging
By the end of the 19th century, New York hosted a Petroleum Exchange for crude oil futures to allow hedging of supplies and more transparent oil prices. Another one arose in California in the 1930’s.
A new era of instability in oil prices came into being with the 1973 Arab oil embargo, and the subsequent nationalization of significant crude oil reserves.
NYMEX
In 1978, the New York Mercantile Exchange (NYMEX) launched a heating oil futures contract, followed by a crude oil contract in 1983, which is now one of the most actively traded physical futures contracts in the world and main benchmarks of oil prices globally.
Crude and products hedging has now matured – with a complex variety of 24/7 global exchanges, futures contracts and options. They help stabilize the global oil pricing structure, and are considered a reliable index for the (often) less visible markets for the sale of physical barrels of crude oil and petroleum products.
Oil Prices: Contango vs. Backwardation
Contango
A contango market occurs when prompt crude oil prices fall below those further out in the future. There are futures contracts for each month going out many years. These prices reflect the market’s current as well as future expectations of oil prices.
Plotted in a chart with time on the x-axis and oil prices on the y-axis, these points create what is called the oil price ‘curve’.
A quick plotting of current oil prices by month(including the recent rebound) produces a curve like this :
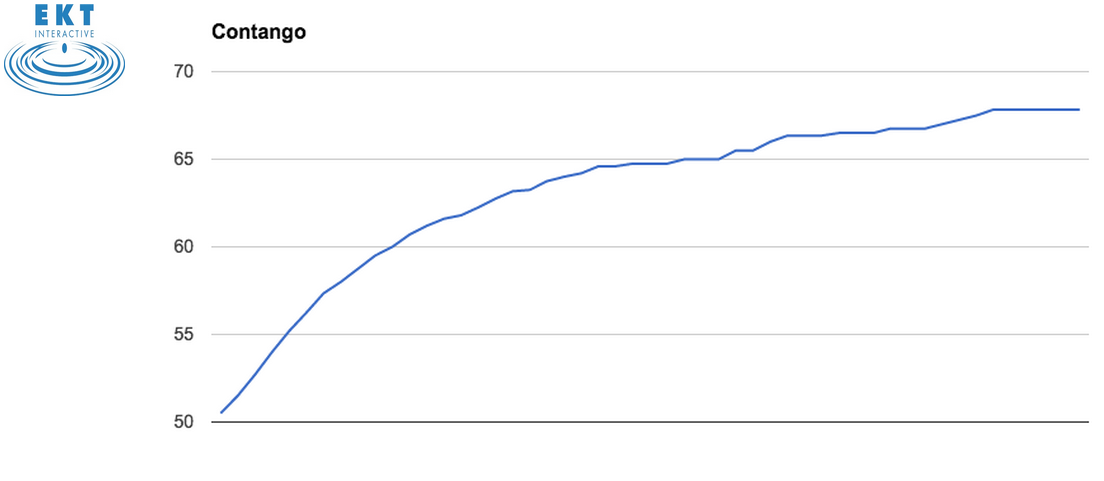
Contango is normal for a non-perishable commodity, like crude oil and products, which have a cost of carry. Such costs include storage fees and interest forgone on money that is tied up in inventory.
Backwardation
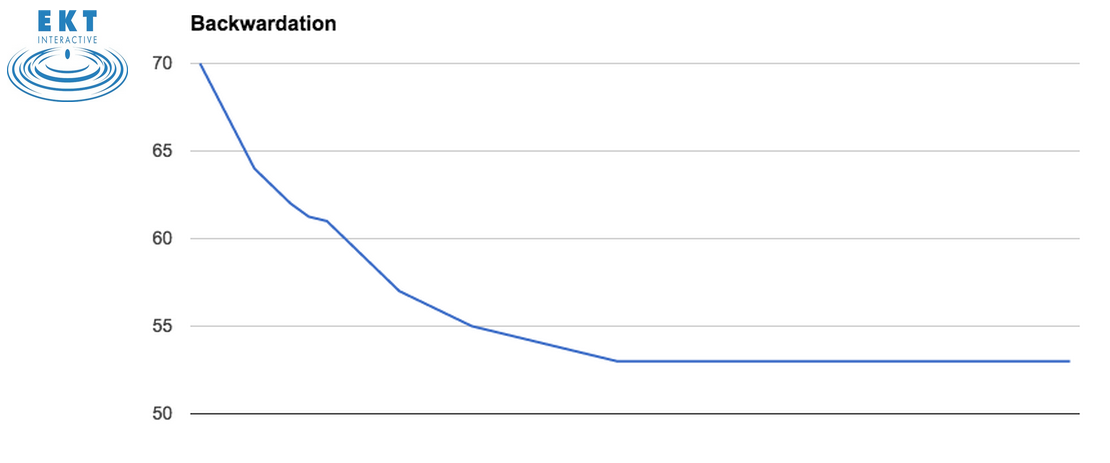
The opposite of contango is a backwardated market, where there is a premium on current oil prices over the future. This occurs when there is increased demand for a product NOW, as has been the case in an expanding global economy post financial crisis.
A market that is steeply in backwardation often indicates a perception of current shortage in the commodity.
A backwardated oil price curve might look like this:
Oil Futures Monthly Contracts:
More Resources and articles on Oil Prices, Supply and Trading:
Article: What is Contango?
Supply, Trading, and Transportation
- Introduction to Supply, Trading and Transportation
- Crude Oil and Product Fundamentals
- Hedging and Financial Contracts
- Supply and Trading Business Drivers
- Supply and Trading Business Processes
- Supply and Trading Trends
More Oil and Gas Training topics include Upstream, Midstream, Downstream, Marketing & Retail.